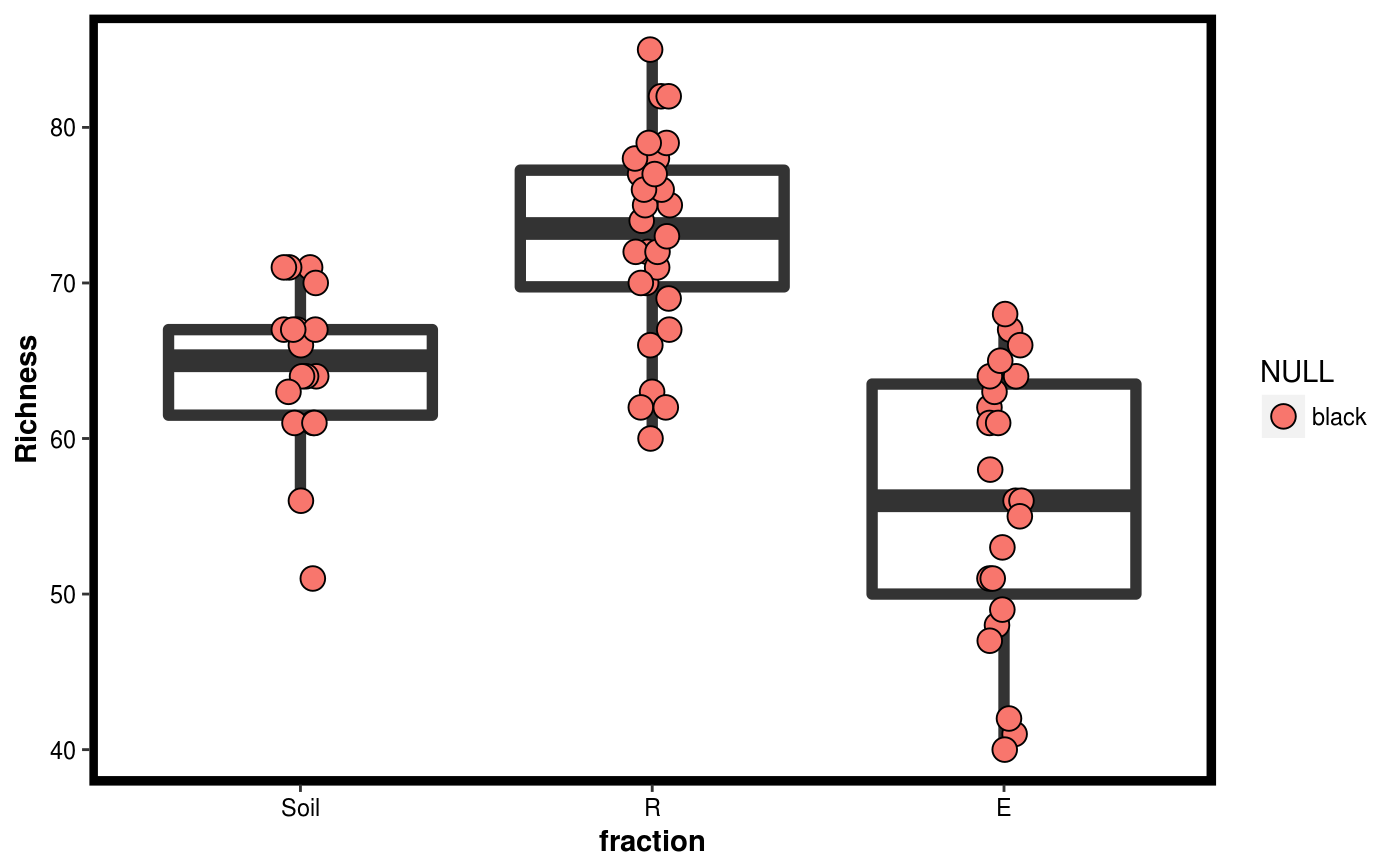
Make a box and whiskers plot of a single variable, while grouping by a variable.
plotgg_var(...)

# S3 method for default
plotgg_var(Map, var.name, x, col = NULL,
  theme = theme_blackbox())

# S3 method for Dataset
plotgg_var(Dat, var.name, x, col = NULL,
  theme = theme_blackbox())
Arguments
| Map | A data.frame where each row must correspond to a sample, and the row names represent sample IDs. |
|---|---|
| var.name | String indicating which variable to plot. Should correspond to a header name in Map |
| x | String indicating which variable to use as the x-axis in the plot. Should correspond to a header name in Map |
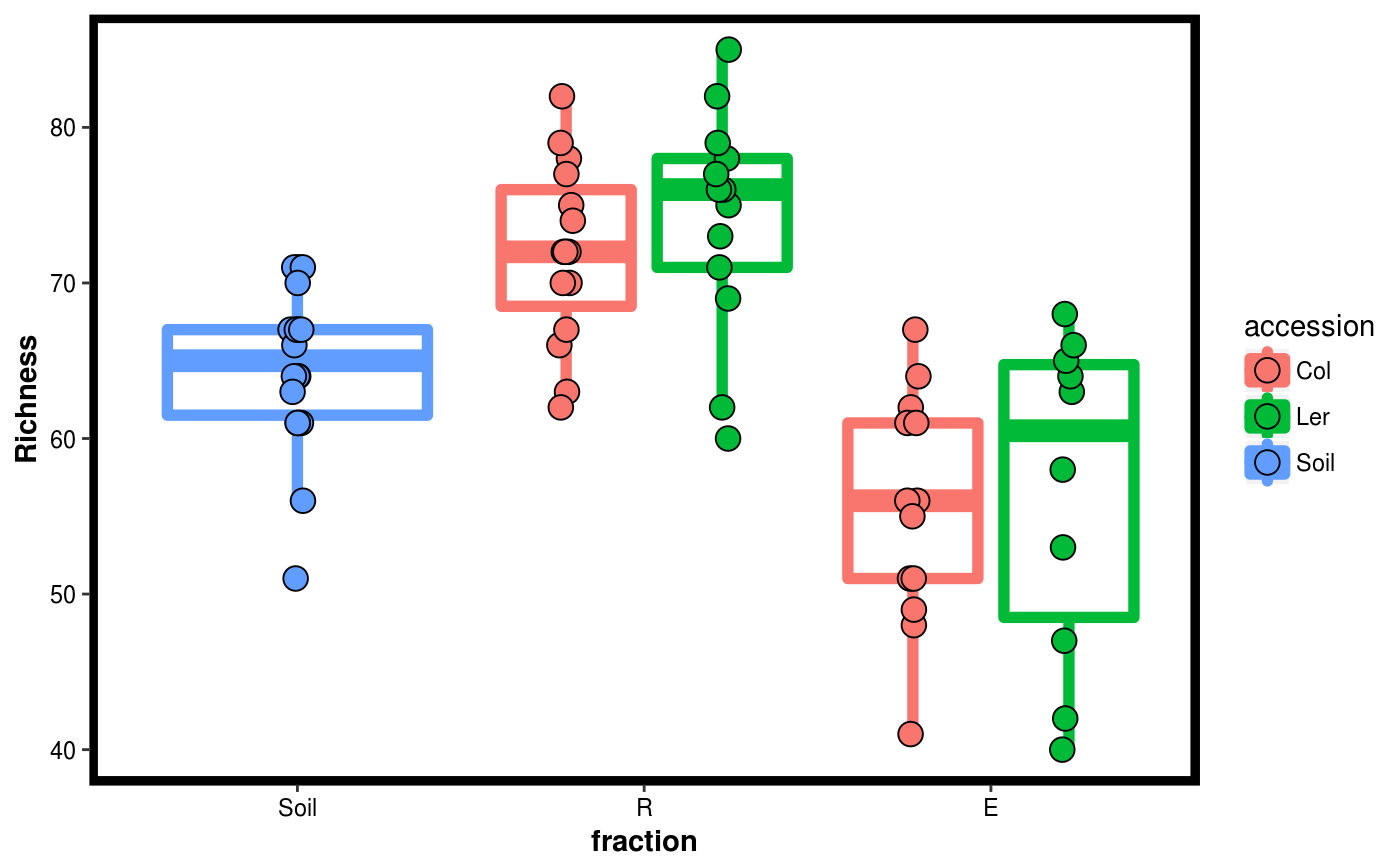
| col | String indicating which variable to use to color the plot. Can be the same or different as x. It should correspond to a header name in Map. |
| theme | A ggplot2 theme to be used woth the plot. |
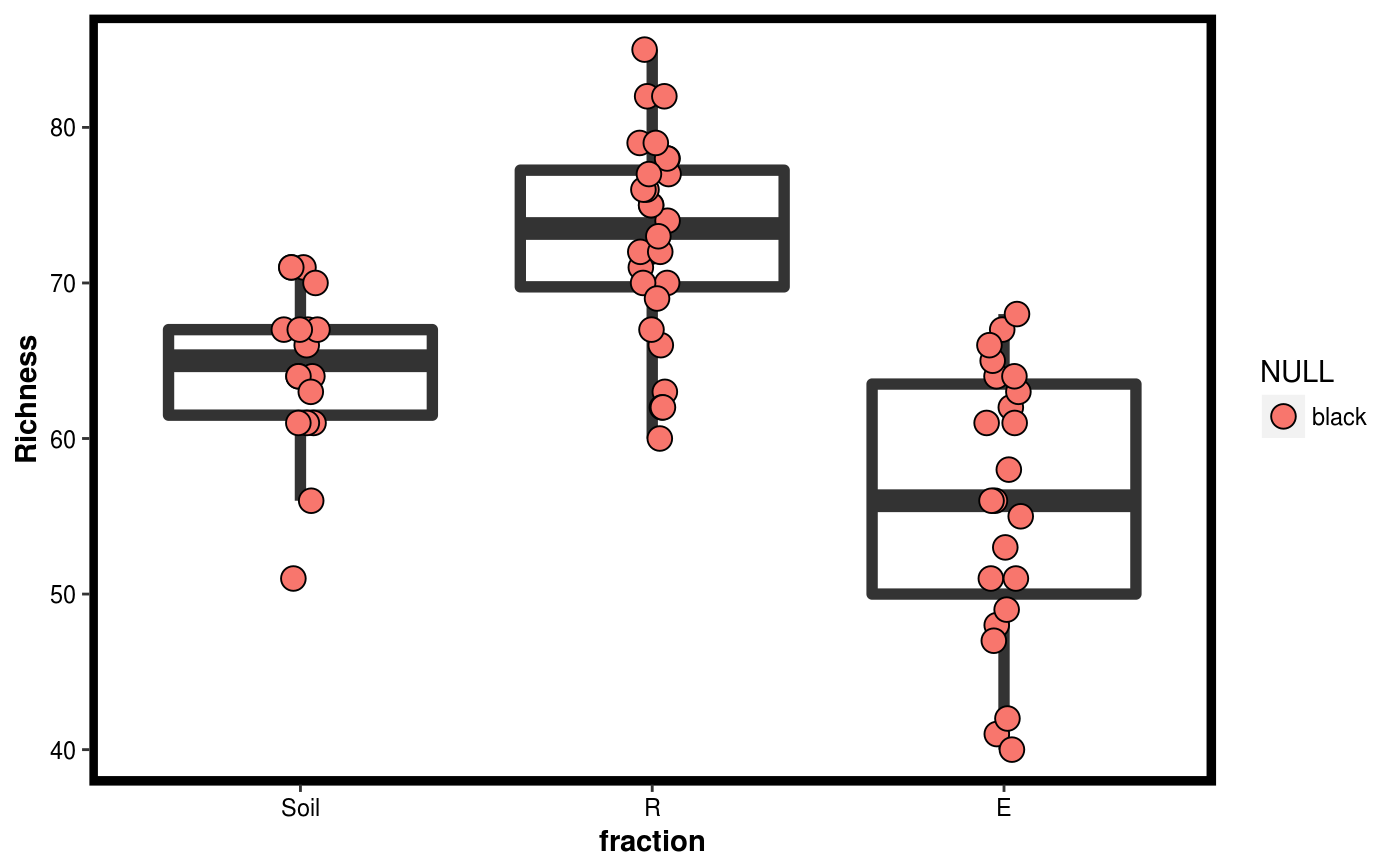
| Dat | A Dataset object |
Value
A ggplot2 plot.
Examples
data(Rhizo) data(Rhizo.map) data(Rhizo.tax) Dat <- create_dataset(Rhizo,Rhizo.map,Rhizo.tax) Dat$Map$Richness <- colSums(Dat$Tab > 0) # Passing directly a data_frame plotgg_var(Dat$Map, var.name = "Richness", x = "fraction")plotgg_var(Dat$Map, var.name = "Richness", x = "fraction",col = "accession")# Passing directly a Dataset object plotgg_var(Dat, var.name = "Richness", x = "fraction")plotgg_var(Dat, var.name = "Richness", x = "fraction", col = "accession")