Function that performs principal component analysis on an abundance matrix.
PCA(x, cor, dim)

# S3 method for default
PCA(x, cor = FALSE, dim = min(nrow(x), ncol(x)))

# S3 method for Dataset
PCA(x, cor = FALSE, dim = min(nrow(x$Tab), ncol(x$Tab)))
Arguments
| x | Numeric matrix where samples are columns and rows are species, or a
Dataset object, see |
|---|---|
| cor | logical value indicating whether the correlation matrix should be used instead of the covariance matrix. |
| dim | Number of dimensions to return. |
Value
A PCA object. Includes the same attributes as a
pca object from the labdsv package.
When the Dataset method is used, it includes two additional slots:
"Map"The Mapping file for the samples.
"Tax"The Taxonomic information of the taxa.
Details
This function is the same as function pca from the
labdsv package, but includes a methdod for Dataset objects.
See also
create_dataset, pca, PCO, pco, plotgg.pca
Examples
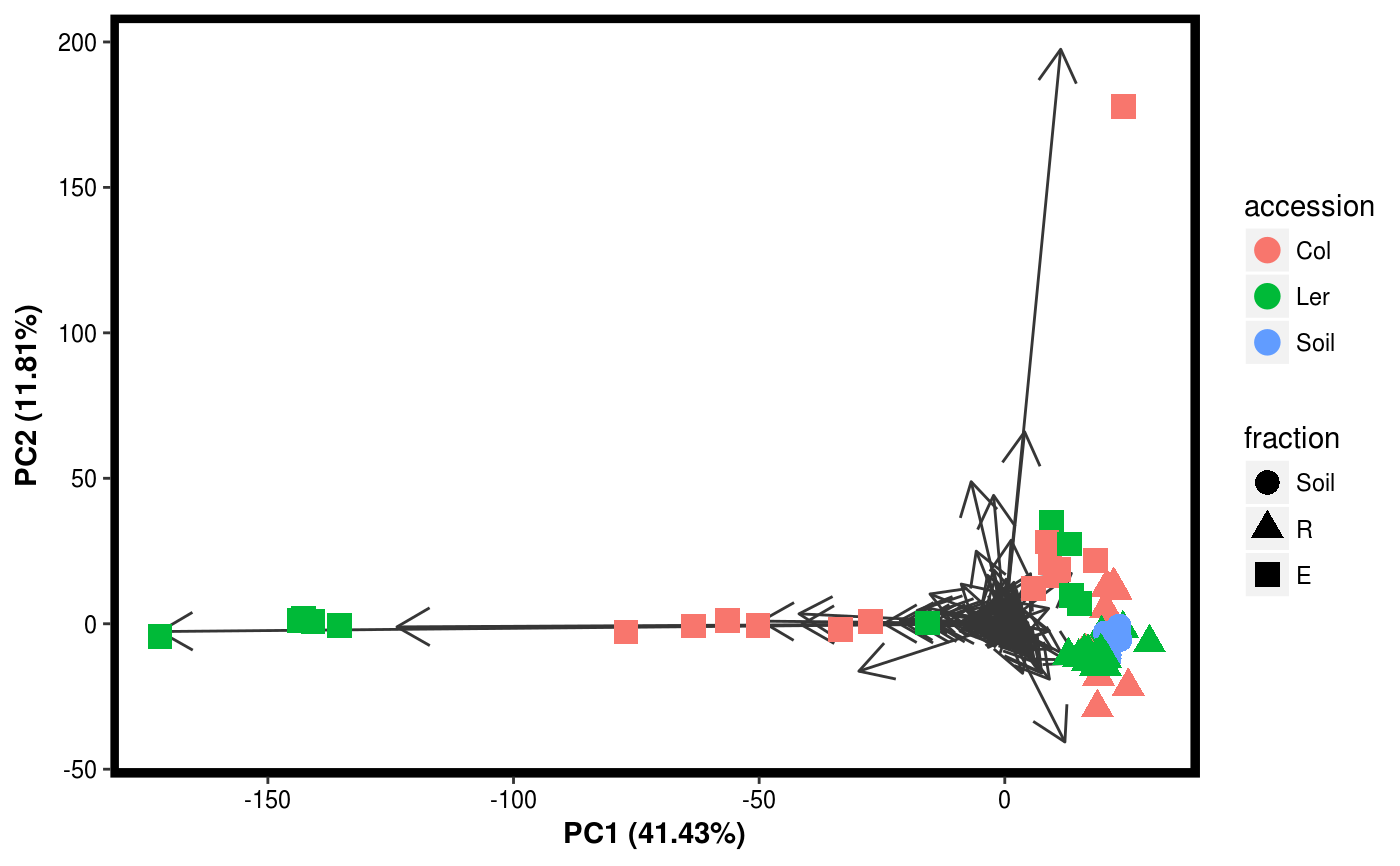
data(Rhizo)
data(Rhizo.map)
Dat <- create_dataset(Rhizo,Rhizo.map)
Dat.pca <- PCA(Dat)
plotgg(Dat.pca,col="accession",shape="fraction",point_size=4,biplot=TRUE)summary(Dat.pca)#> Principal Component Analysis:
#> 	 69  Components
#>
#>   Component Var.explained Cumulative
#> 1       PC1         41.43      41.43
#> 2       PC2         11.81      53.24
#> 3       PC3          7.15      60.39
#> 4       PC4          6.56      66.95
#> 5       PC5          6.18      73.13