Compare diversity accross sites and groups of samples.
Source:R/site_diversity.r
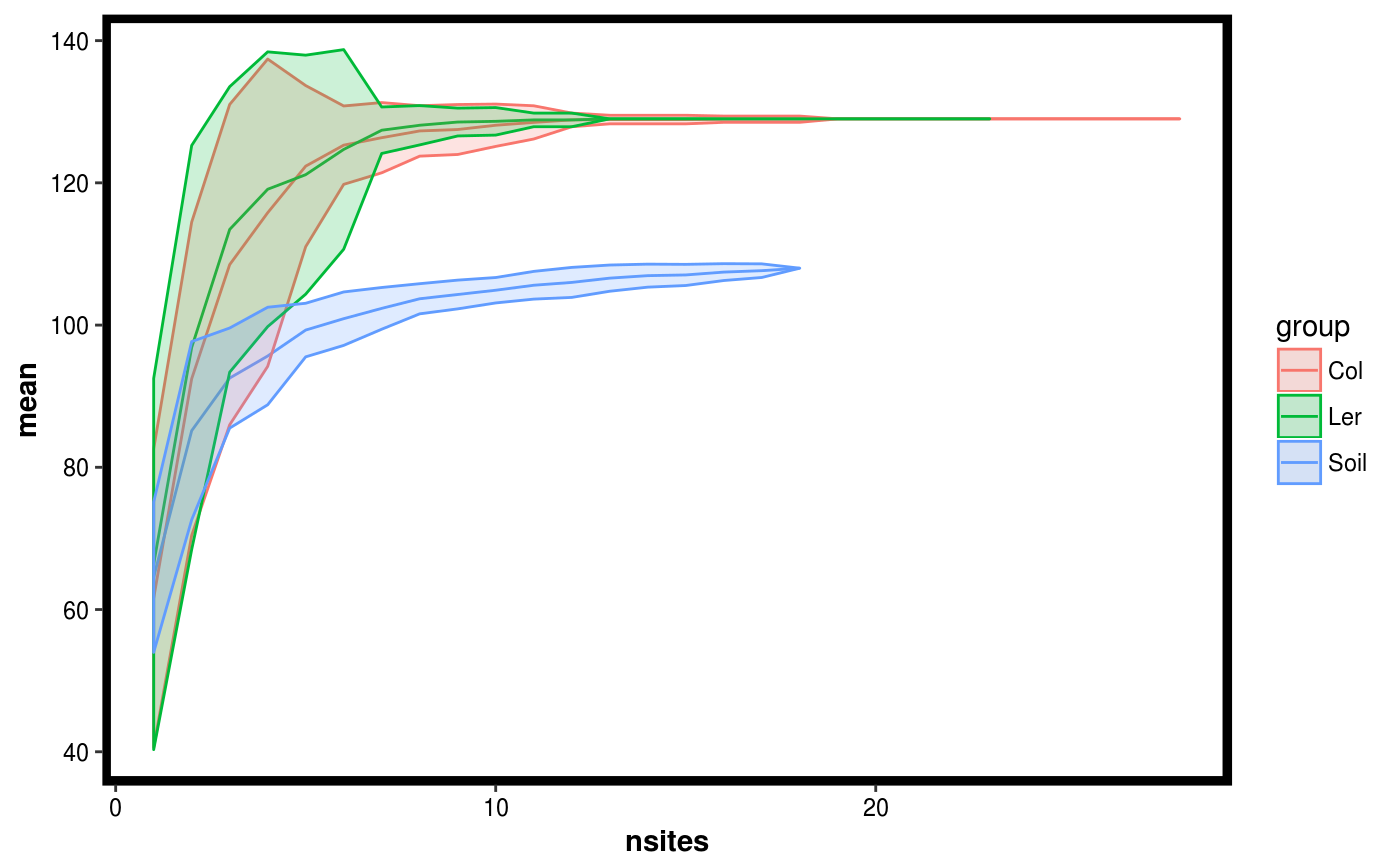
compare_site_diversity.RdPerforms permuation to estimate diversity as a function of adding sites. And does this for samples grouped according to a factor.
compare_site_diversity(...)

# S3 method for default
compare_site_diversity(Tab, Map, factor,
  divfun = total_richness, nperm = 20)

# S3 method for Dataset
compare_site_diversity(Dat, factor, divfun = total_richness,
  nperm = 20)
Arguments
| Tab | A numeric matrix of samples as columns and taxa as rows. |
|---|---|
| Map | A data.frame containing the variables to be modelled as columns and samples as rows. The rows should be named with sample IDs and must correspond to the column names from x if an abundance matrix was passed |
| factor | String representing the name of the variable to be used for grouping samples. Must correspond to a header name in the Mat portion of the Dataset object. |
| divfun | Function that returns a diversity estimate given a matrix of samples. See total_richness and examples to see how to define your function. |
| nperm | Number of permutations to perform. |
| Dat | A Dataset object. |
Value
A data.frame of class site.diversity which contains the following variables:
- mean
Mean diversity value of all permutations
- sd
Standard deviation of the diversity estimates estimated from the permutations.
- nsites
Number of sites (ie. samples).
- group
Variable used for selecting the samples.
See also
Examples
data(Rhizo) data(Rhizo.map) data(Rhizo.tax) Dat <- create_dataset(Rhizo,Rhizo.map,Rhizo.tax) sitediv.accession <- compare_site_diversity(Dat = Dat,factor = "accession", divfun = total_richness, 20) plotgg(sitediv.accession)# The following code requires the vegan package # divfun <- function(x){ # if(!is.null(ncol(x))) # x <- rowSums(x) # s <- vegan::diversity(x) # return(s) # } # sitediv.accession <- compare_site_diversity(Dat = Dat, # factor = "accession", # divfun = divfun, 20) # plotgg(sitediv.accession, alpha = 0.3) + # scale_color_brewer(palette = "Set3") + # scale_fill_brewer(palette = "Set3")