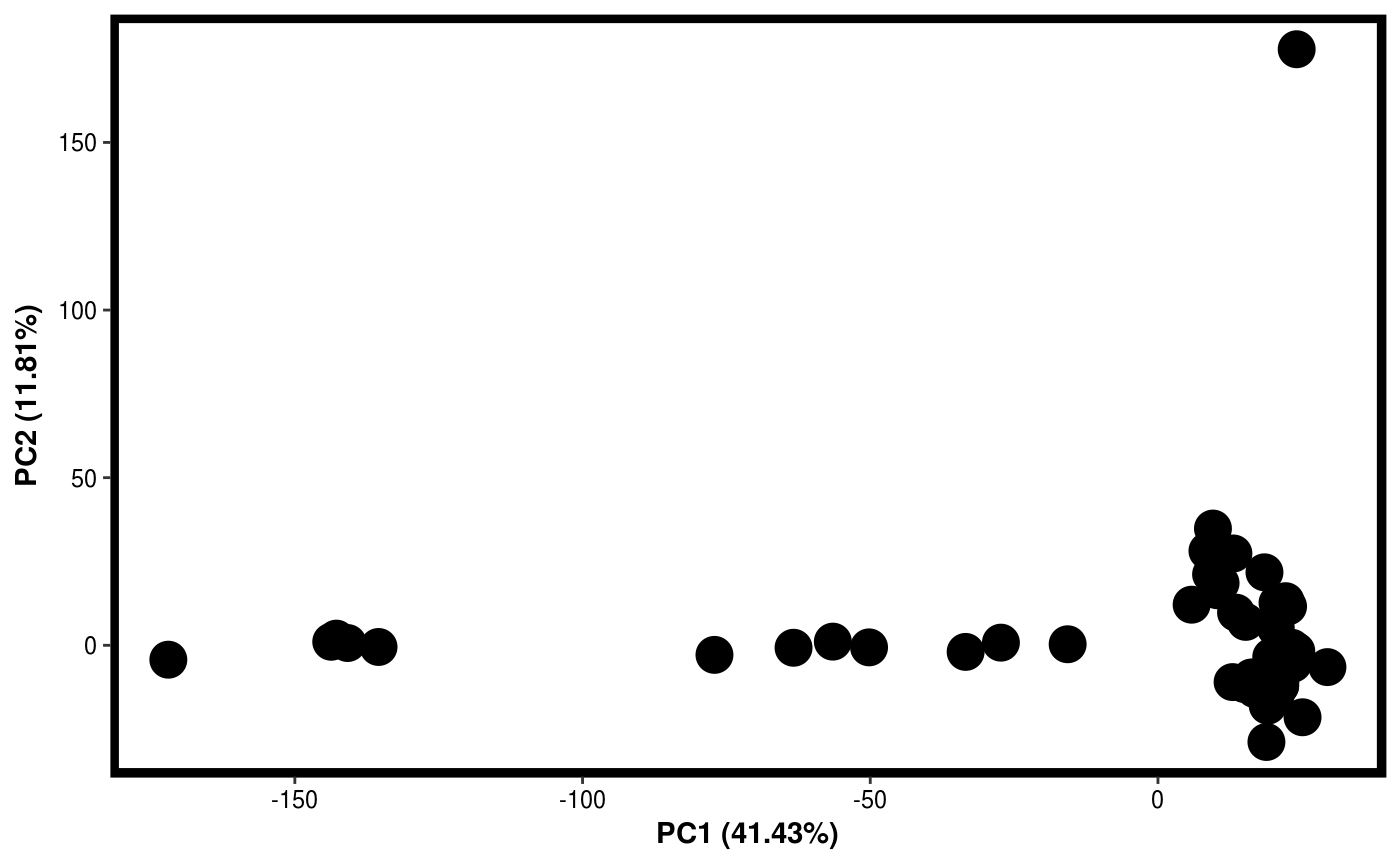
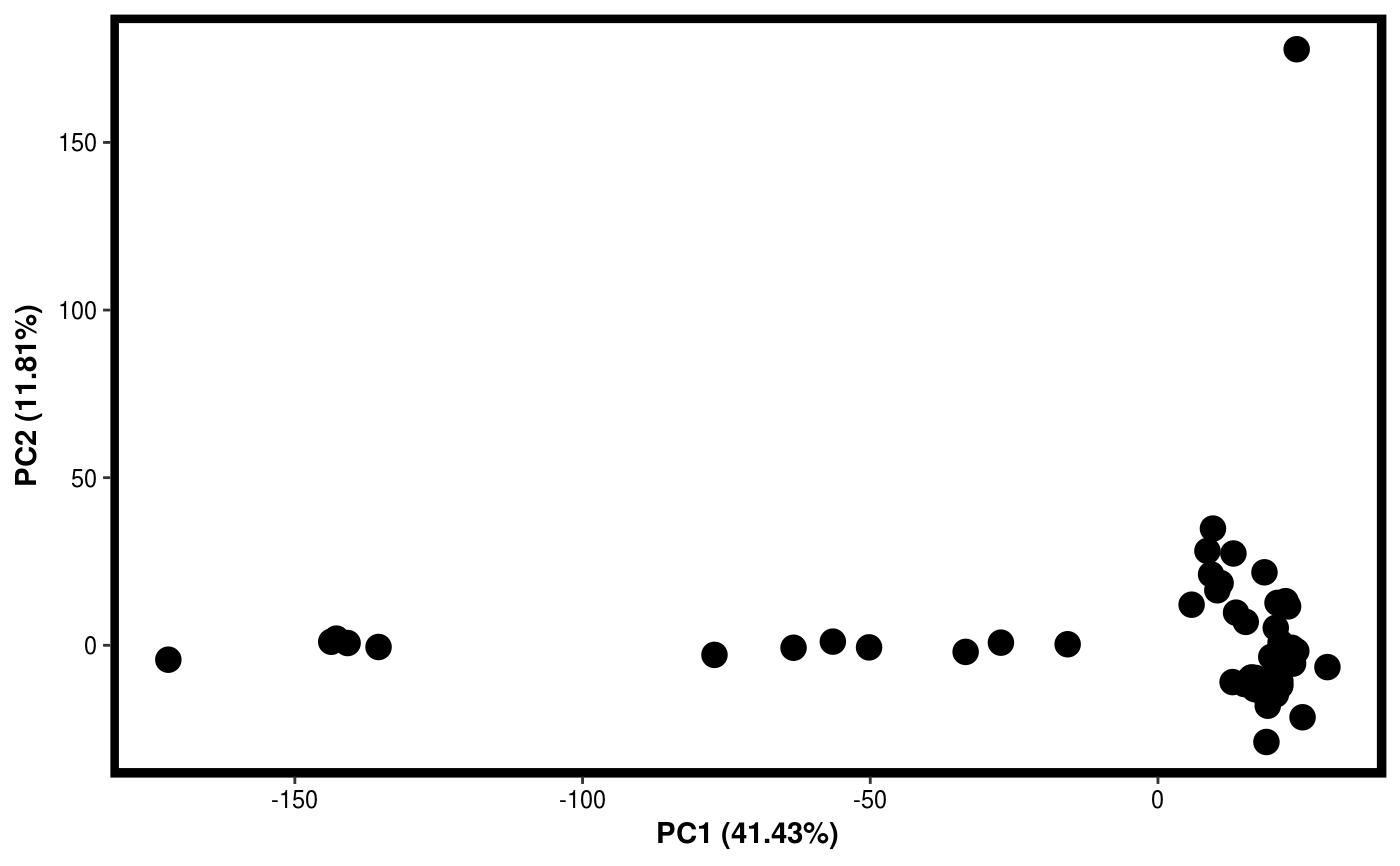
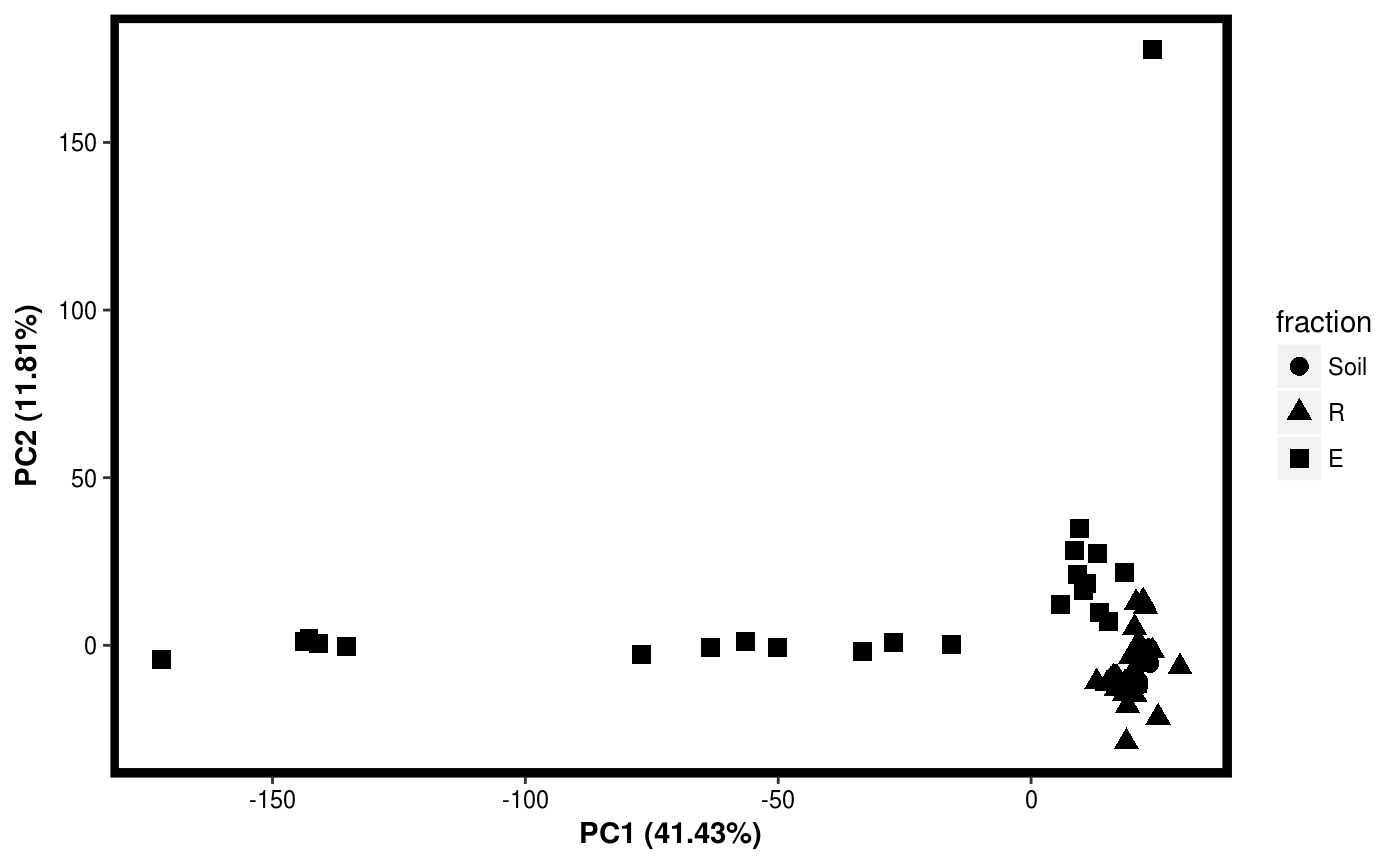
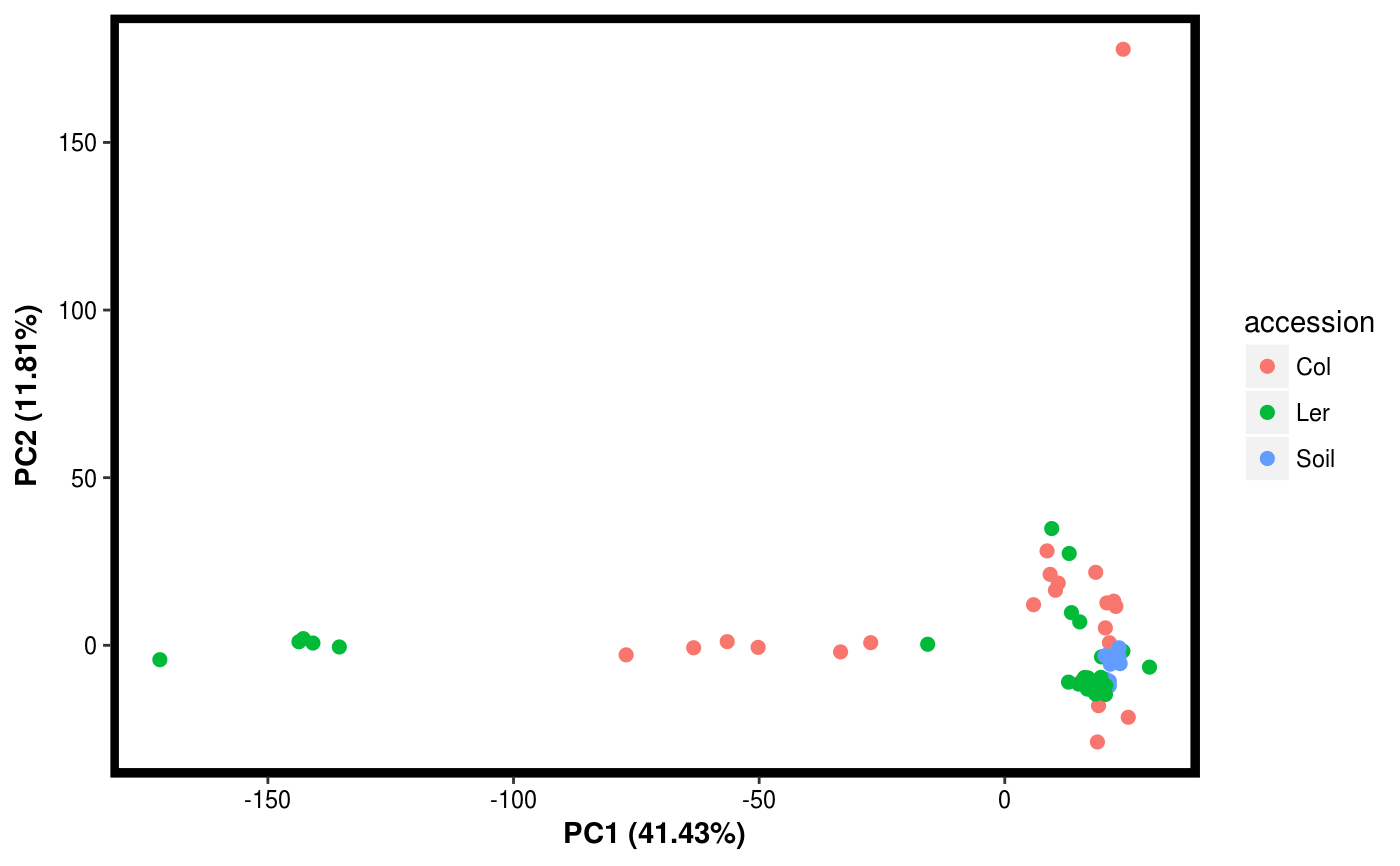
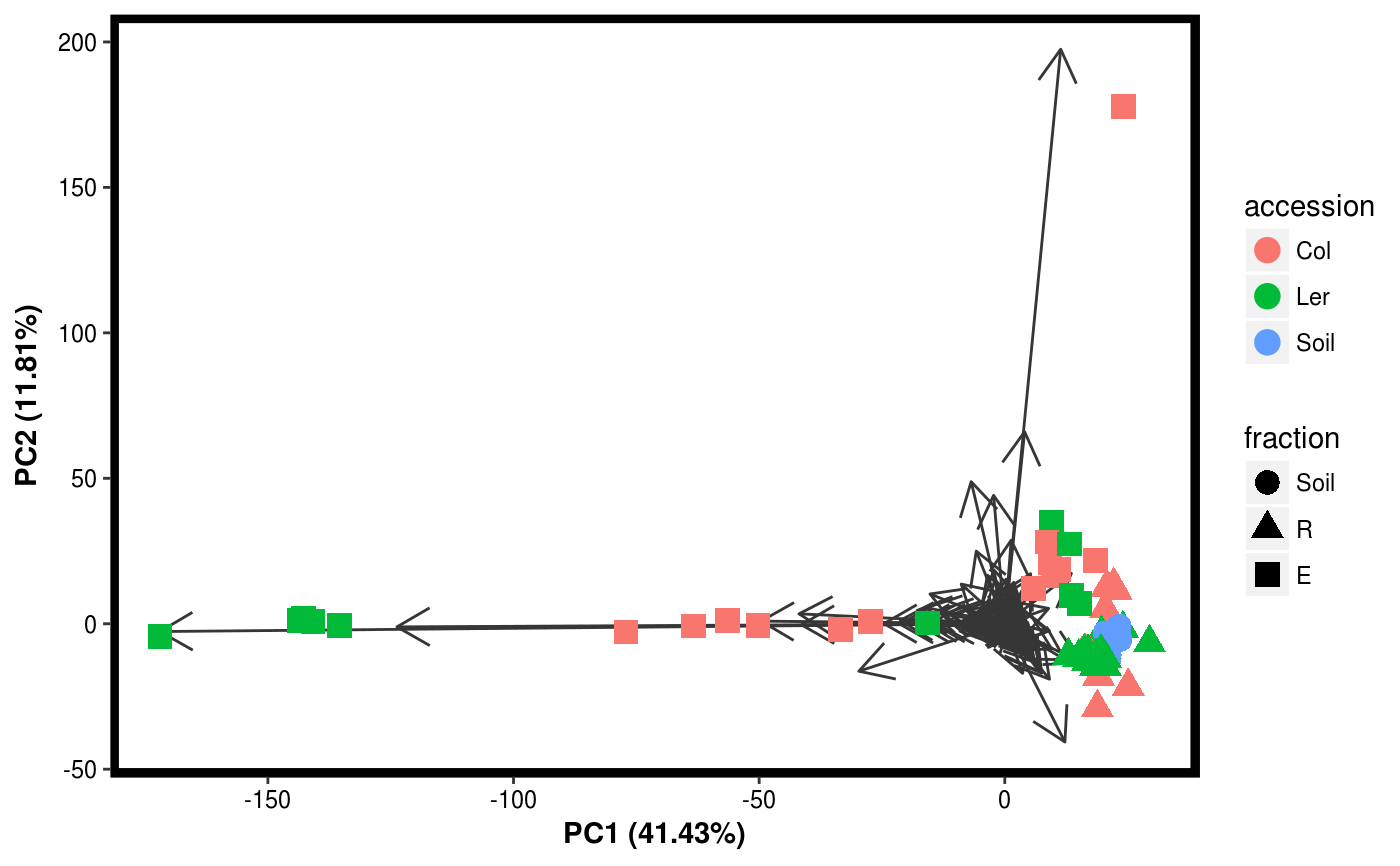
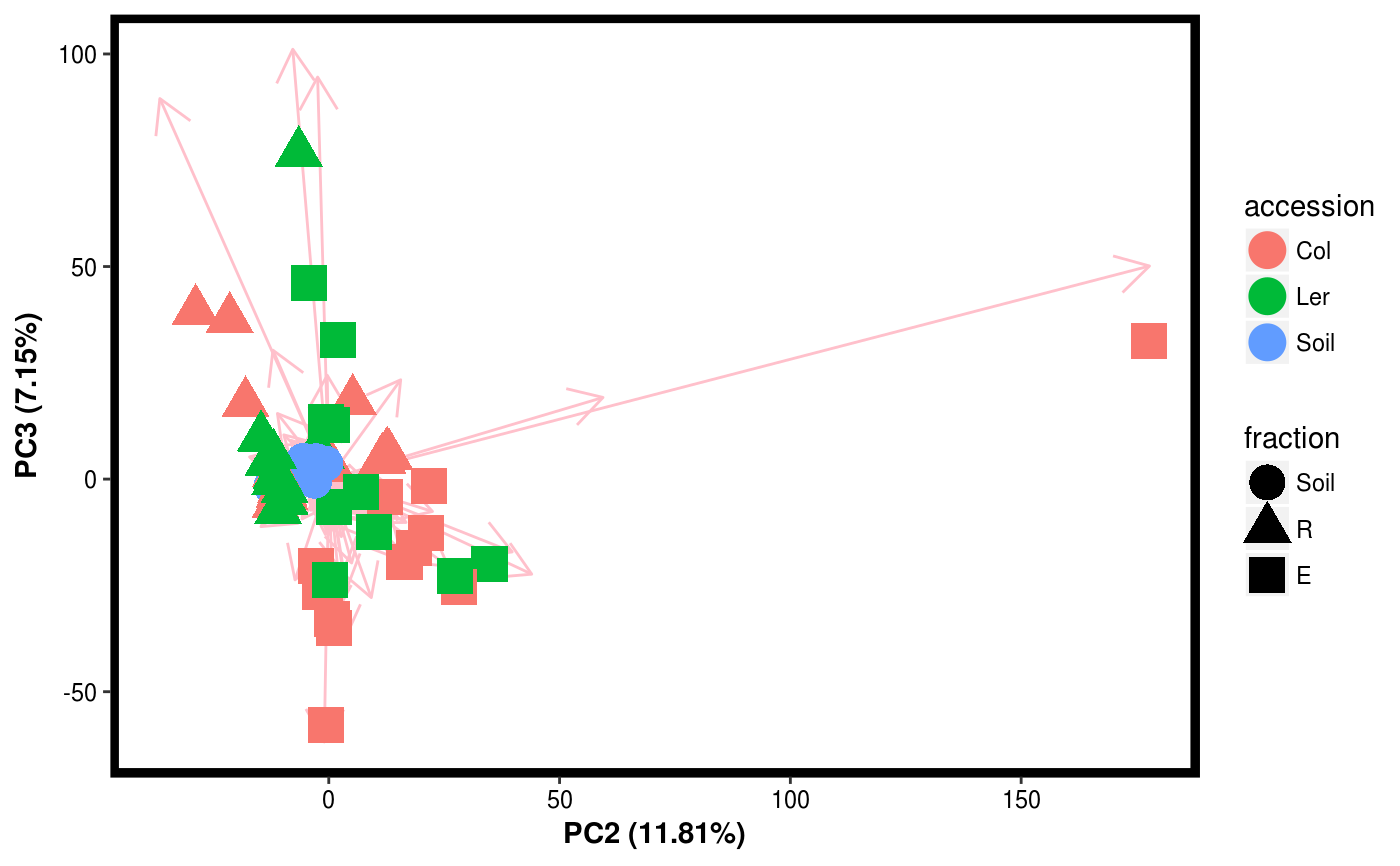
Function for plotting results of PCA.
# S3 method for PCA
plotgg(x, components = c("PC1", "PC2"), shape = NULL,
  col = NULL, fill = NULL, biplot = FALSE, biplot_color = "grey21",
  point_size = 2)
Arguments
| x | A |
|---|---|
| components | Vector of length 2 indicating which components to plot. |
| shape | String indicating which variable to use as aestetics mapping for shape. Must correspond to a column header in the Map attribute of the PCA object. |
| col | String indicating which variable to use as aestetics mapping for color. Must correspond to a column header in the Map attribute of the PCA object. |
| fill | String indicating which variable to use as aestetics mapping for fill. Must correspond to a column header in the Map attribute of the PCA object. |
| biplot | Logical indicating whether the loadings should be plotted as well. |
| biplot_color | Color to use for the loadings in a biplot |
| point_size | size for the points in the plot |
Value
A ggplot2 object of the PCA plot.
See also
Examples
data(Rhizo) data(Rhizo.map) Dat <- create_dataset(Rhizo,Rhizo.map) Dat.pca <- PCA(Dat) plotgg(PCA(Dat$Tab),point_size=6)p1 <- plotgg(Dat.pca,col="accession",components=c("PC2","PC3"),shape="fraction",biplot=TRUE,biplot_color="pink",point_size=6) p1