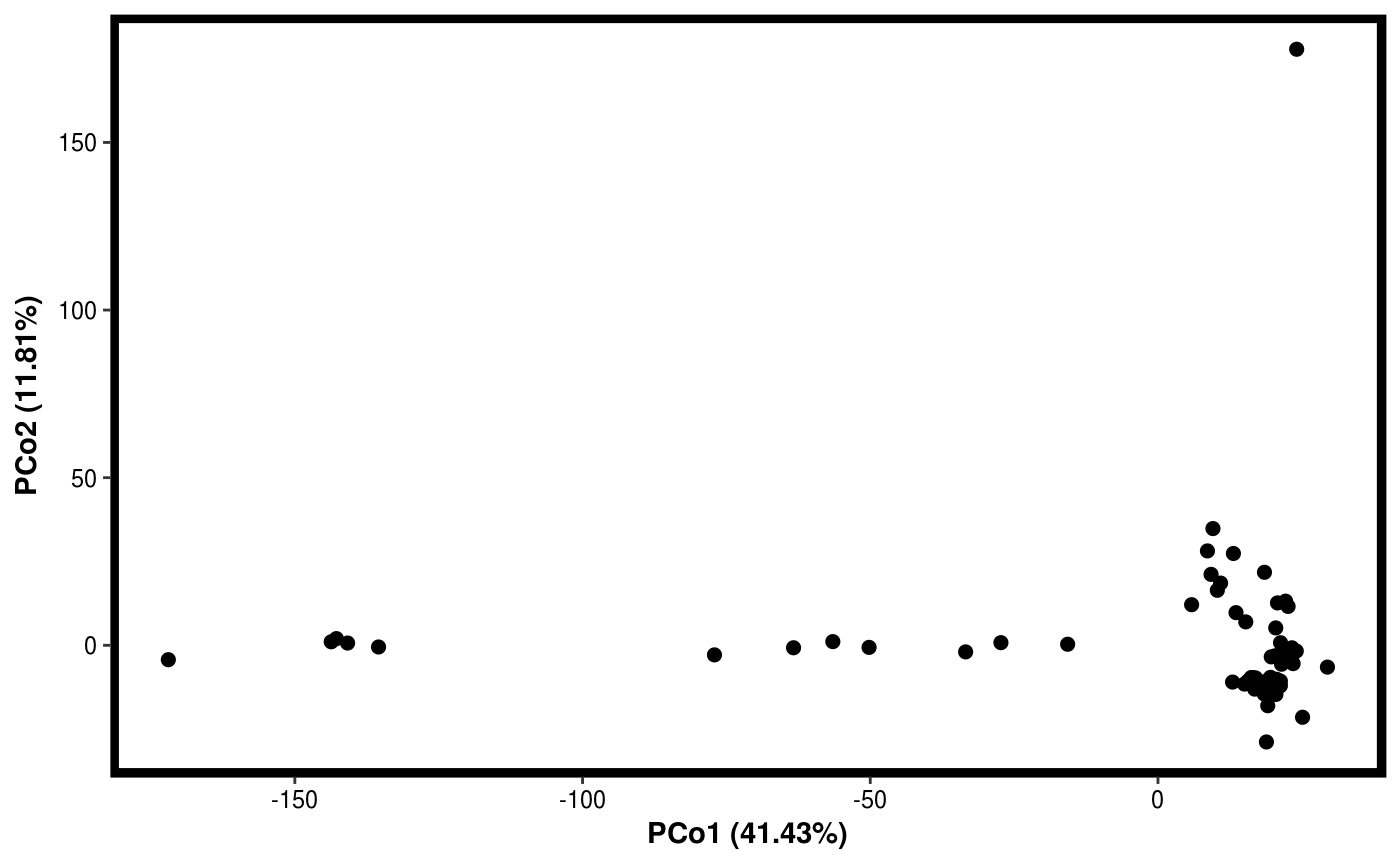
Function for plotting results of PCO.
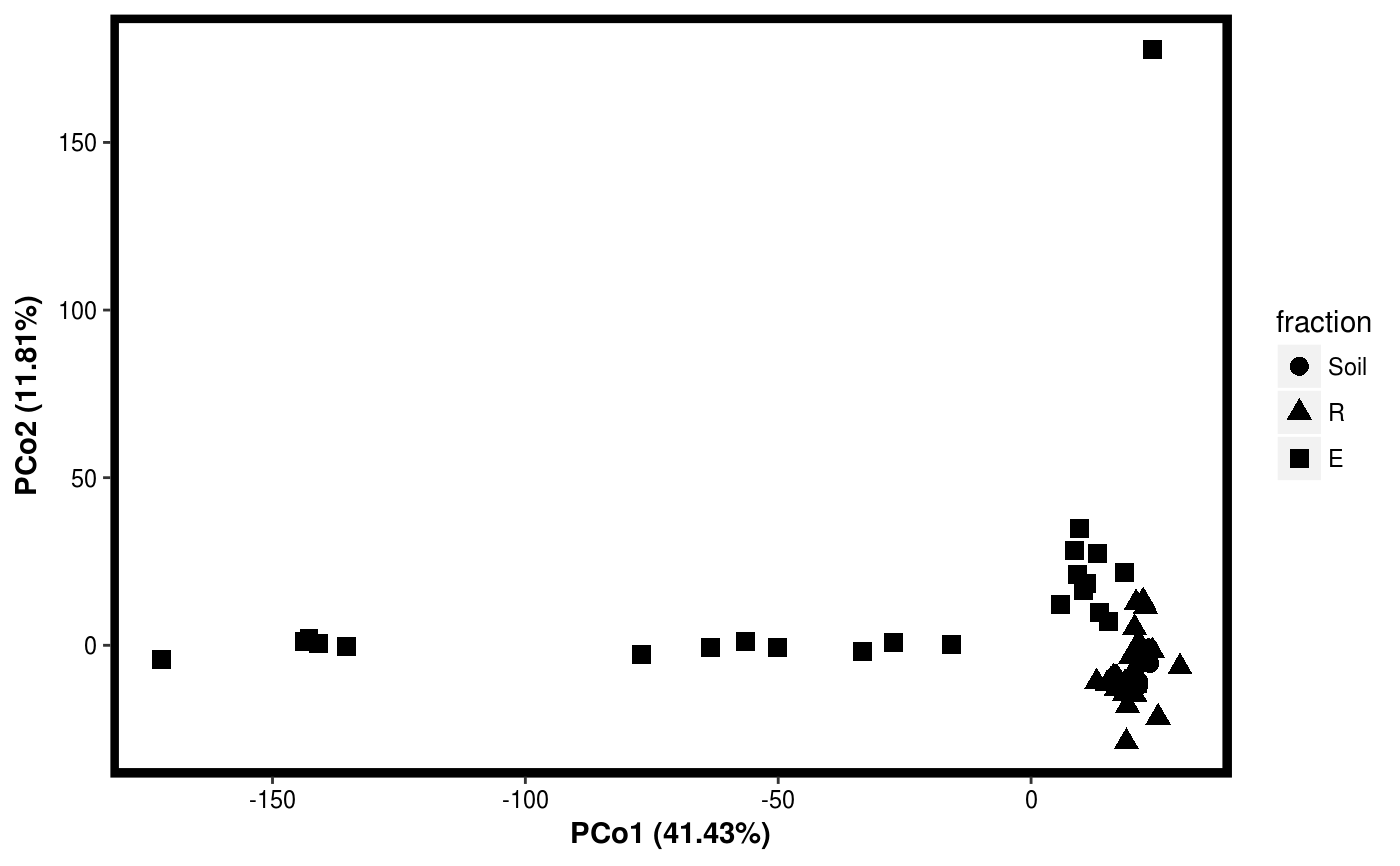
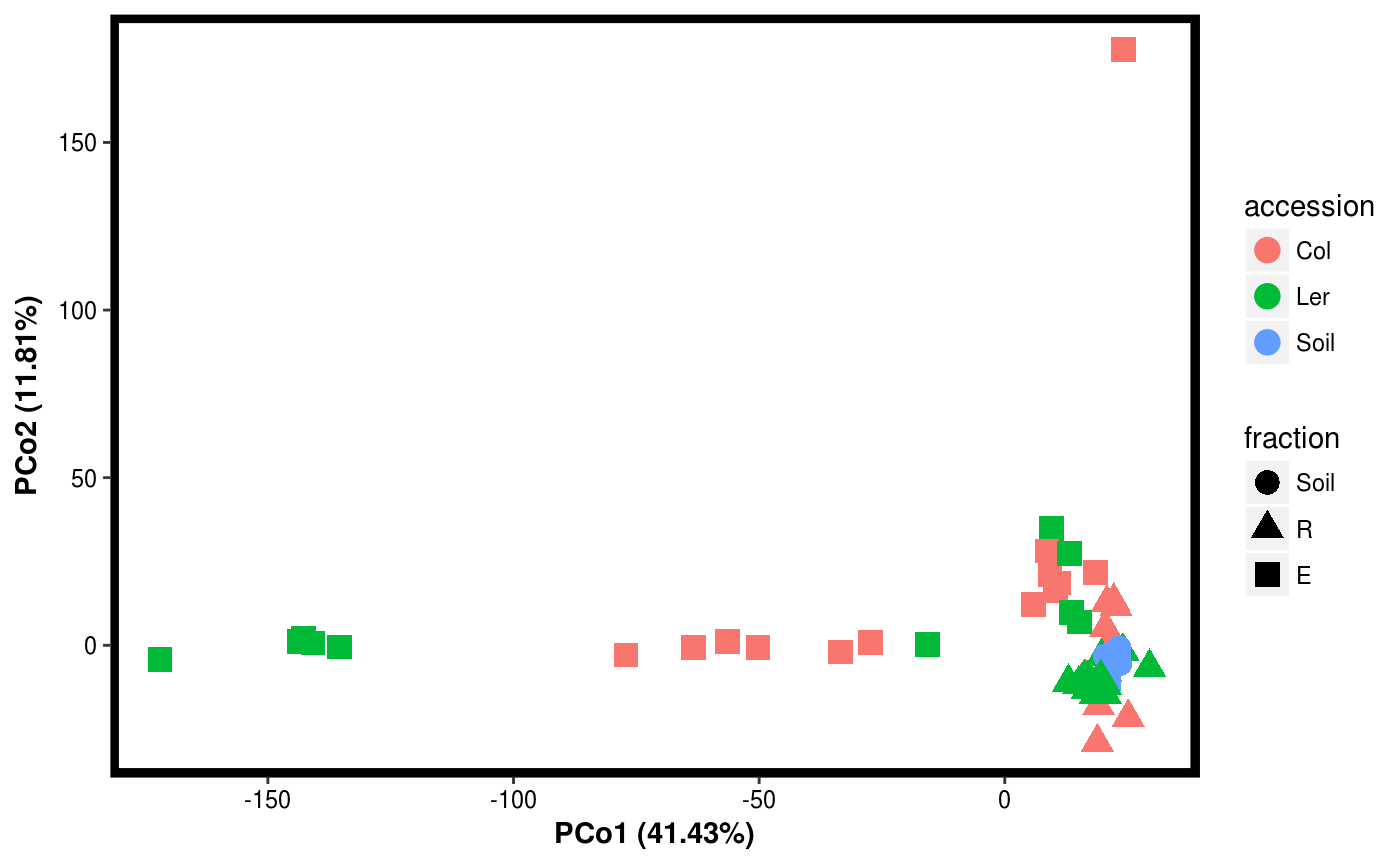
# S3 method for PCO
plotgg(x, components = c("PCo1", "PCo2"), shape = NULL,
  col = NULL, fill = NULL, point_size = 2)
Arguments
| x | A |
|---|---|
| components | Vector of length 2 indicating which components to plot. |
| shape | String indicating which variable to use as aestetics mapping for shape. Must correspond to a column header in the Map attribute of the PCO object. |
| col | String indicating which variable to use as aestetics mapping for color. Must correspond to a column header in the Map attribute of the PCO object. |
| fill | String indicating which variable to use as aestetics mapping for fill. Must correspond to a column header in the Map attribute of the PCO object. |
| point_size | point_size |
Value
A ggplot2 object of the PCoA plot.
See also
Examples
data(Rhizo) data(Rhizo.map) Dat <- create_dataset(Rhizo,Rhizo.map) # distfun <- function(x) vegan::vegdist(x,method="bray") #requires vegan package distfun <- dist Dat.pco <- PCO(Dat,dim=2,distfun=distfun) plotgg(Dat.pco)