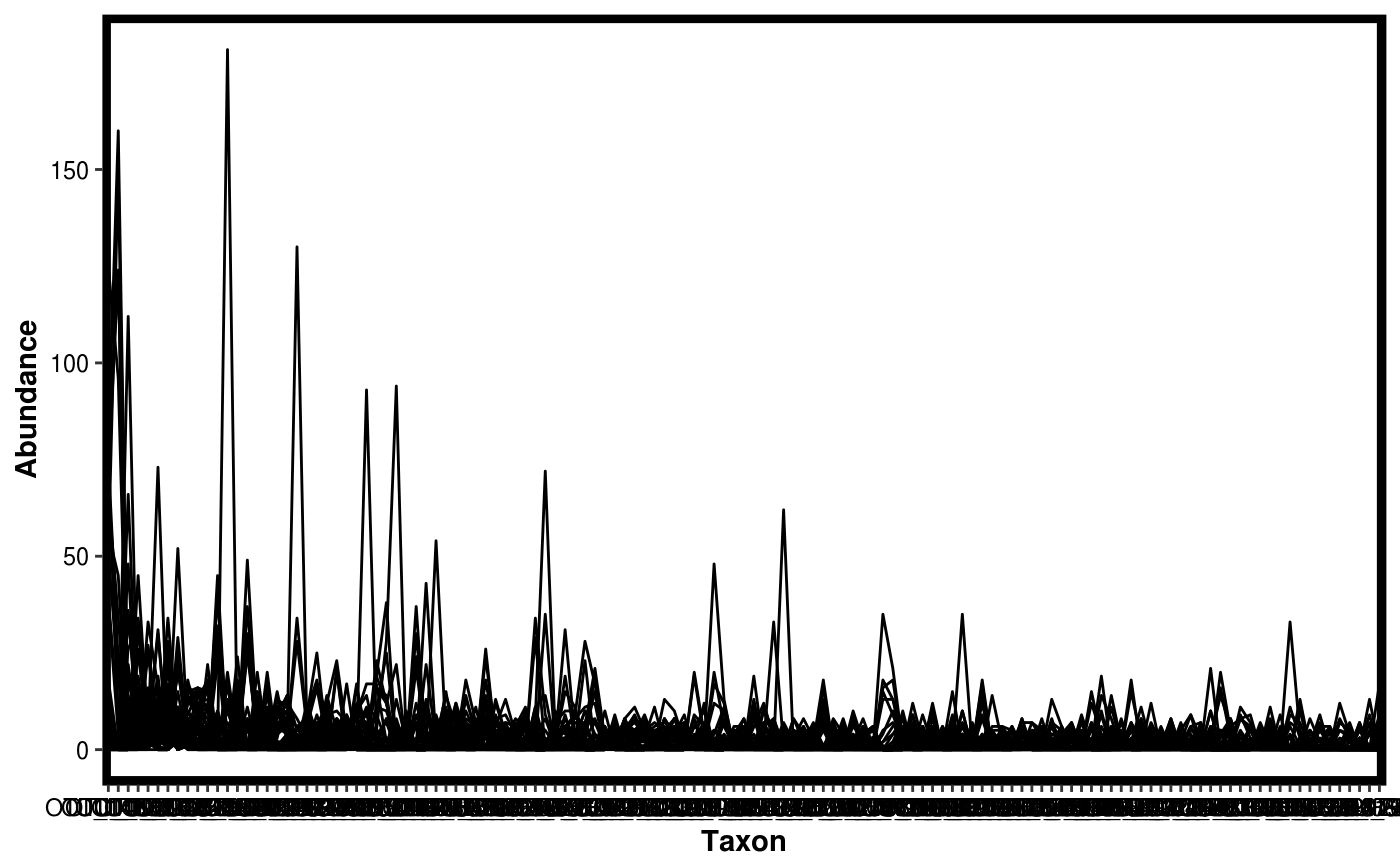
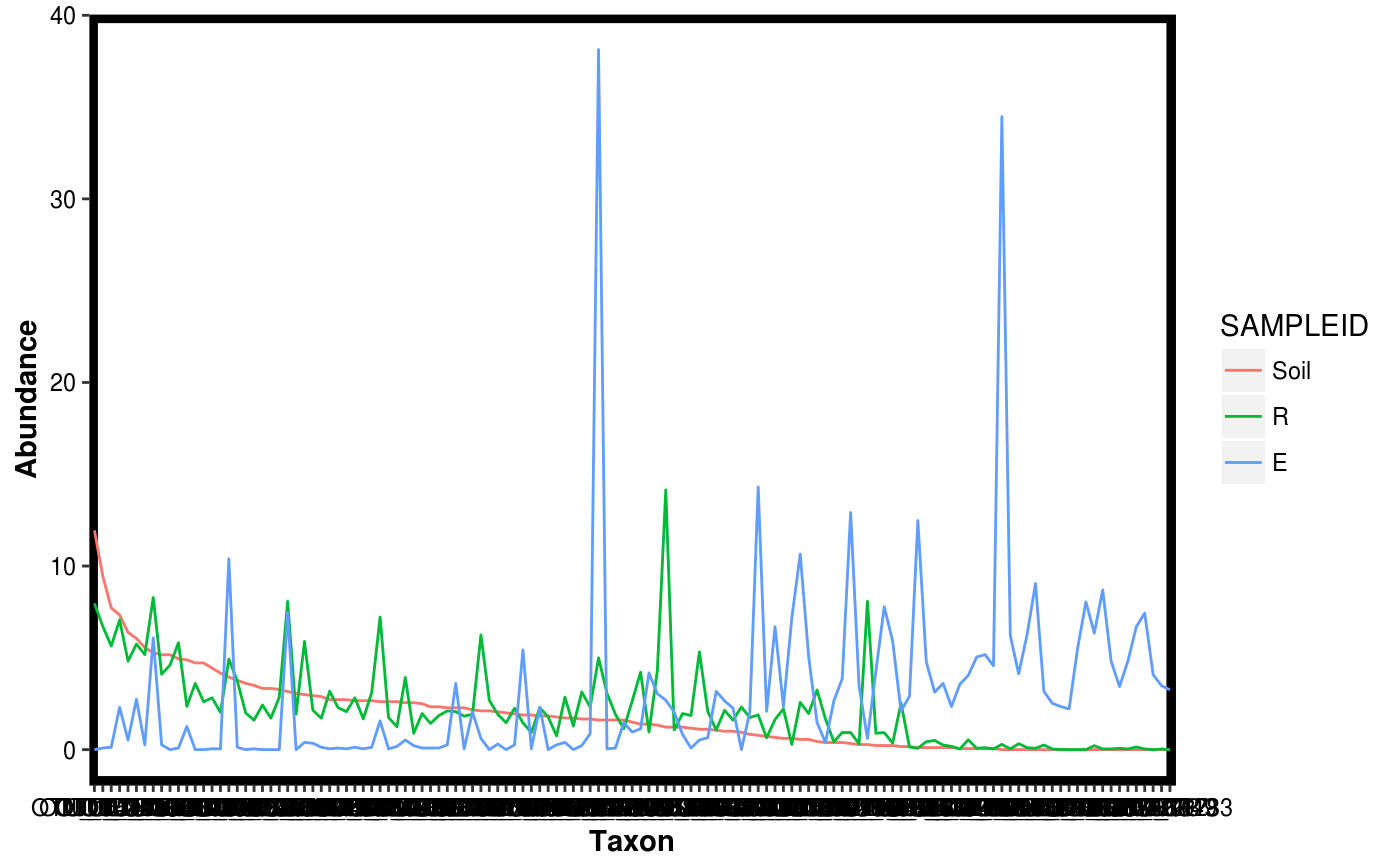
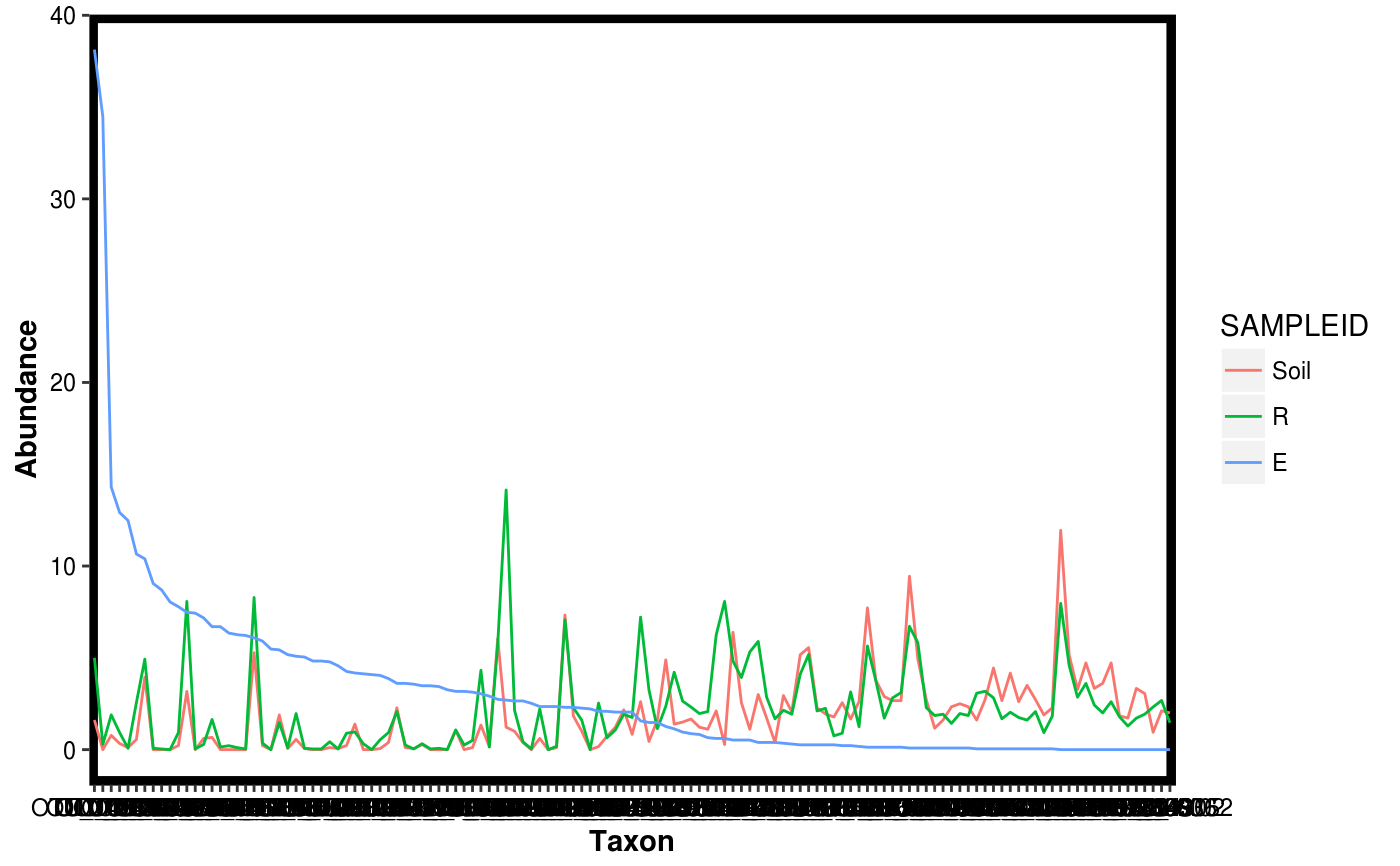
Make a rank abundance plot from a Dataset object.
plotgg_rankabun(...)

# S3 method for default
plotgg_rankabun(Tab, Map = NULL, groupby = NULL,
  sortby = NULL, theme = theme_blackbox(), variable.name = "Taxon",
  value.name = "Abundance", FUN = mean)

# S3 method for Dataset
plotgg_rankabun(Dat, groupby = NULL, sortby = NULL,
  theme = theme_blackbox(), variable.name = "Taxon",
  value.name = "Abundance", FUN = mean)
Arguments
| Tab | A matrix object with samples as columns and taxa as rows. |
|---|---|
| Map | A data frame with metadata for Tab. Each row must be a sample with row names matching column names in Tab and in the same order as in Tab. |
| groupby | Variable name to be used for grouping samples before plotting th rank abundance. |
| sortby | Variable value to be used as reference for sorting the taxa in the rank abundance plot. |
| theme | ggplot2 theme to be used for plotting. |
| variable.name | x-axis label in the plot. |
| value.name | y-axis label in the plot. |
| FUN | Function to use to aggregate samples according to groupby |
| Dat | A Dataset object. |
Value
A ggplot2 plot.
See also
Examples
data(Rhizo) data(Rhizo.map) data(Rhizo.tax) Dat <- create_dataset(Rhizo,Rhizo.map,Rhizo.tax) plotgg_rankabun(Tab = Dat$Tab)plotgg_rankabun(Tab = Dat$Tab, Map = Dat$Map,groupby = "fraction",sortby = "Soil")plotgg_rankabun(Dat)plotgg_rankabun(Dat, groupby = "fraction", sortby = "E")