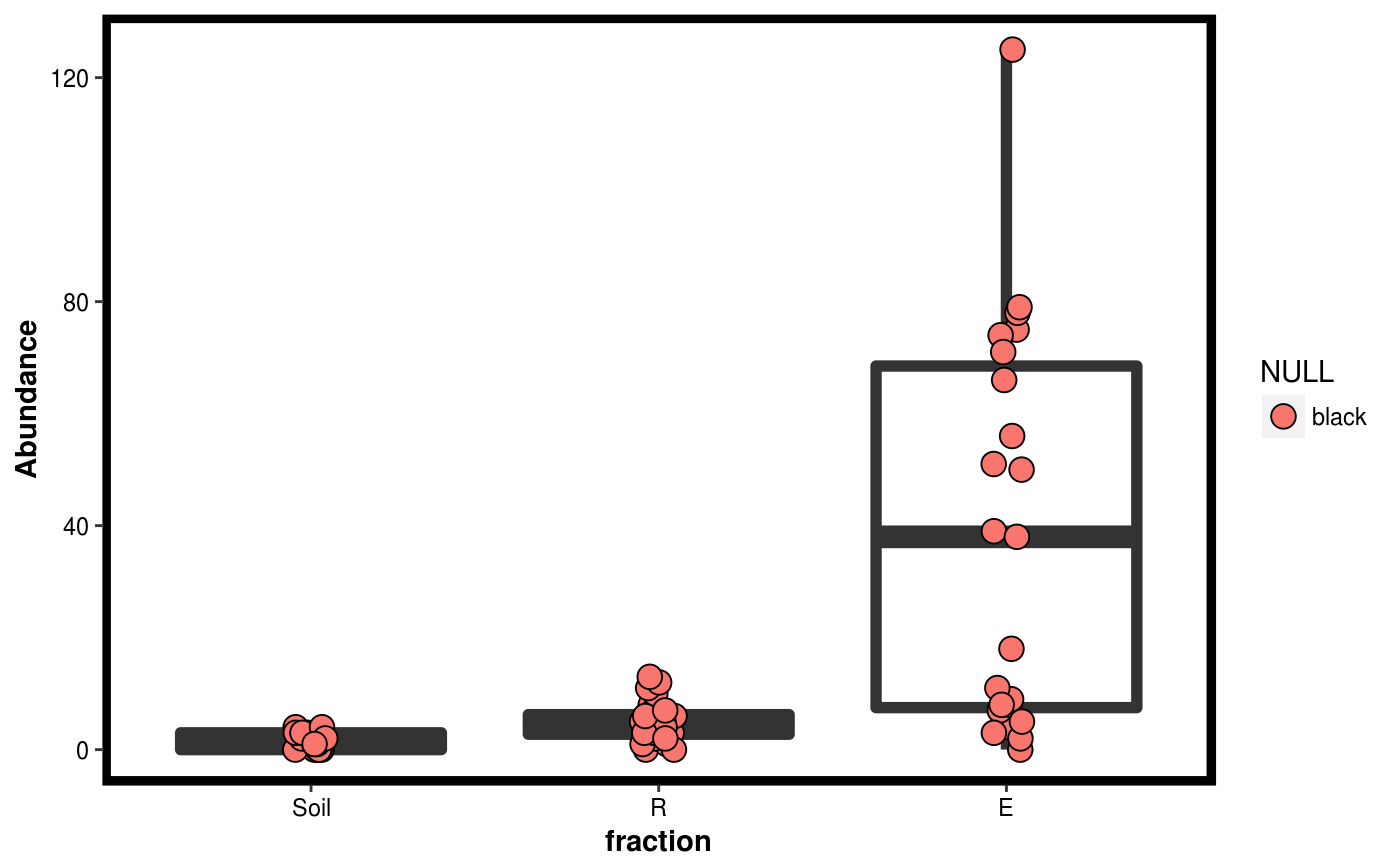
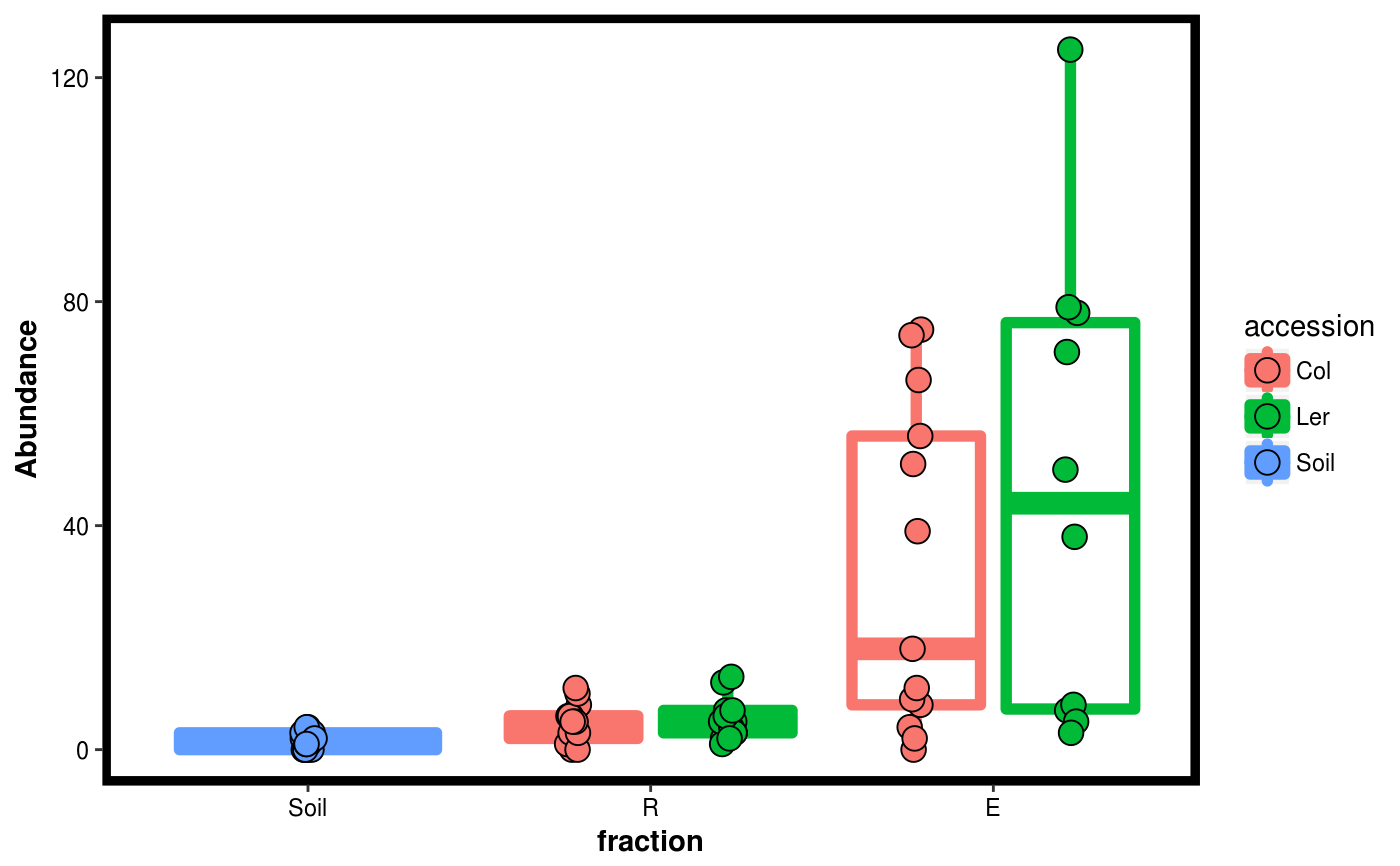
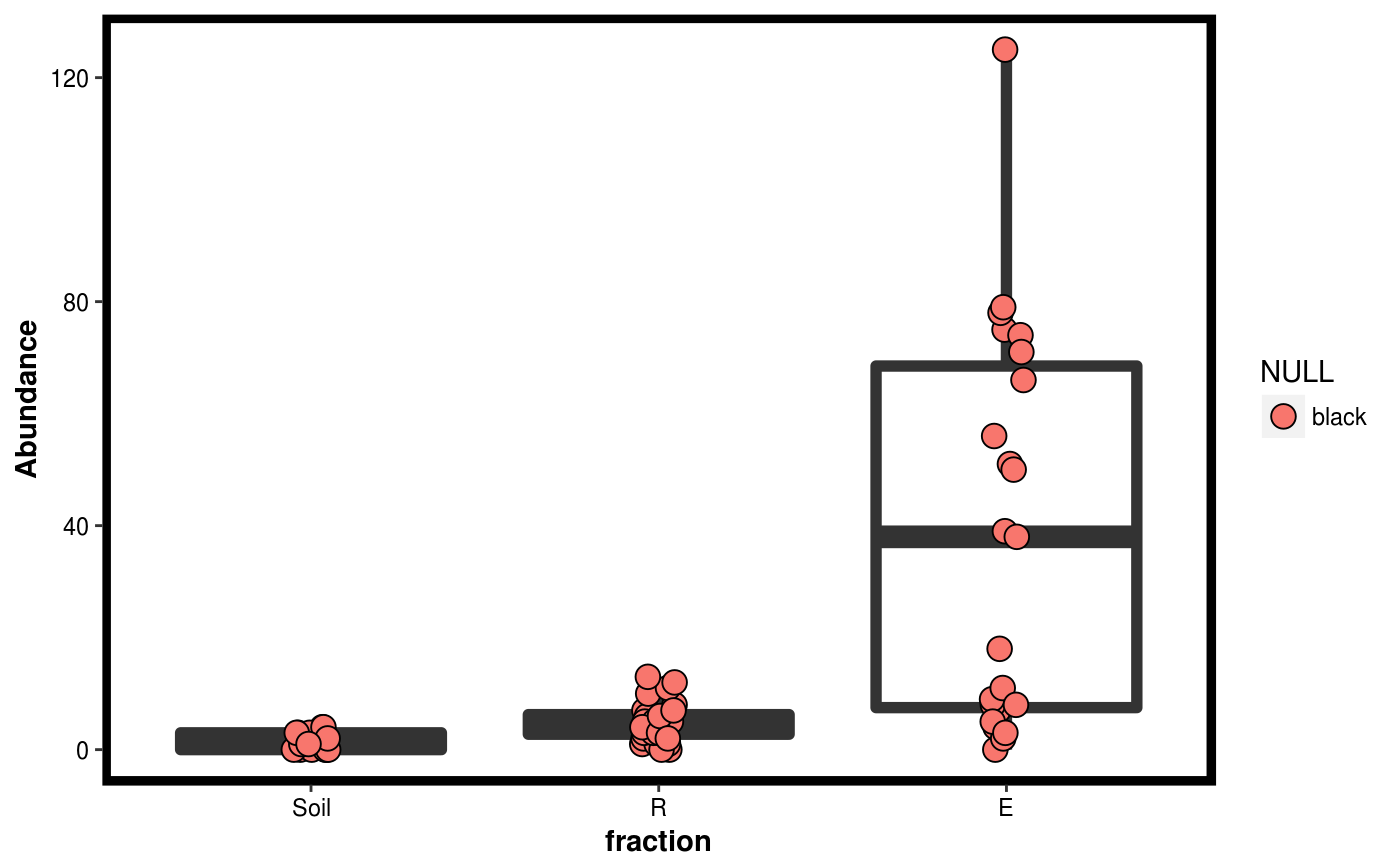
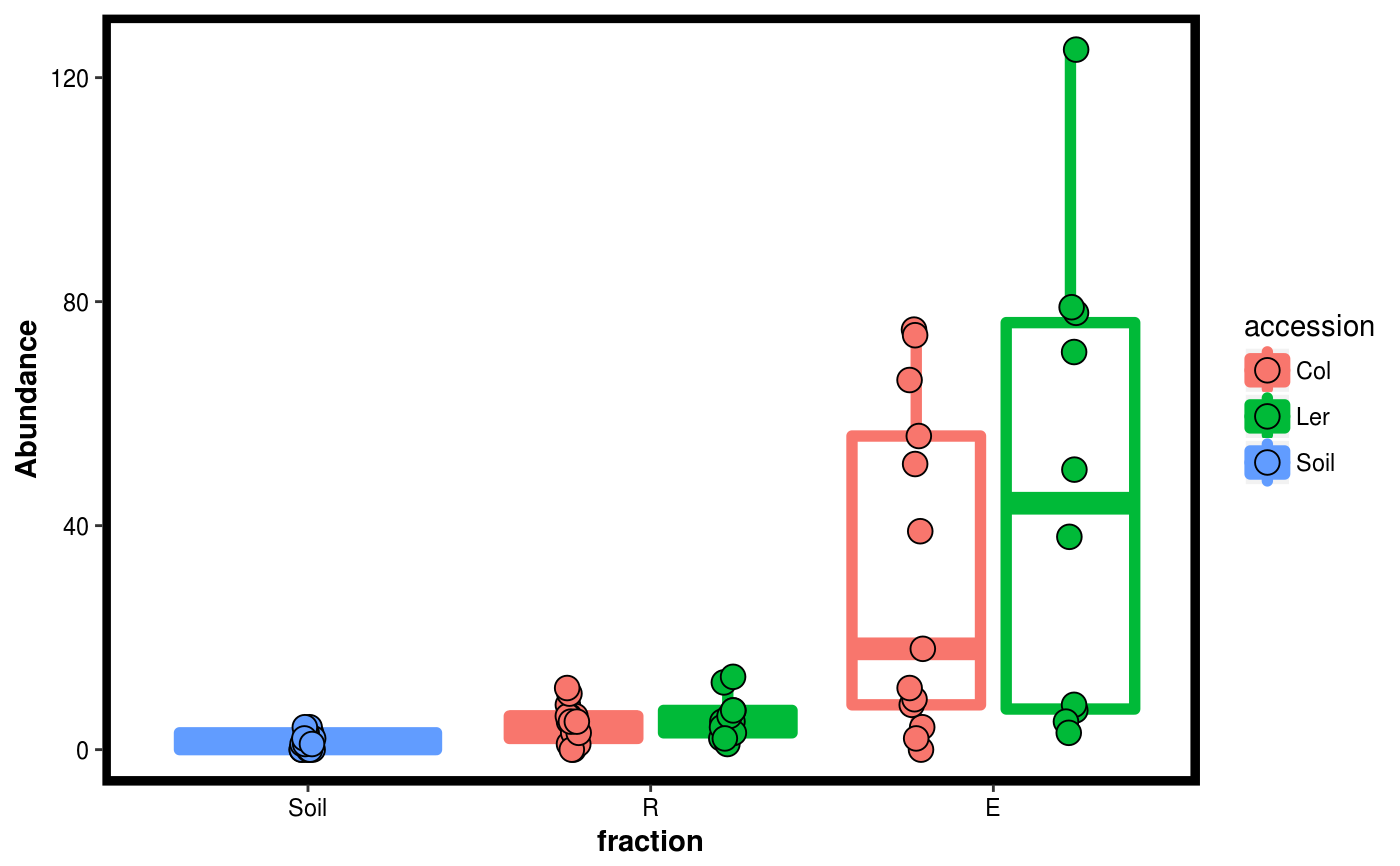
Make a box and whiskers plot of a single taxon, while grouping by a variable.
plotgg_taxon(...)

# S3 method for default
plotgg_taxon(Tab, Map, taxon, x, col = NULL,
  var.name = "Abundance", theme = theme_blackbox())

# S3 method for Dataset
plotgg_taxon(Dat, taxon, x, col = NULL,
  var.name = "Abundance", theme = theme_blackbox())
Arguments
| Tab | Matrix with samples as columns and taxa as rows. |
|---|---|
| Map | Data frame with metadata for Tab. Each row must correspond to a sample in Tab, they must be in the same order, and be named with the same names as the columns in Tab |
| taxon | String indicating which taxon to plot. |
| x | String indicating which variable to use as the x-axis in the plot. Should correspond to a header name in Map |
| col | String indicating which variable to use to color the plot. Can be the same or different as x. It should correspond to a header name in Map. |
| var.name | y-axis label on the plot. |
| theme | A ggplot2 theme to be used woth the plot. |
| Dat | A Dataset object. |
Value
A ggplot2 plot
See also
Examples
data(Rhizo) data(Rhizo.map) data(Rhizo.tax) Dat <- create_dataset(Rhizo,Rhizo.map,Rhizo.tax) # Passing independently an abundance table and mapping file plotgg_taxon(Tab = Dat$Tab, Map = Dat$Map, taxon = "OTU_14834", x = "fraction")plotgg_taxon(Tab = Dat$Tab, Map = Dat$Map, taxon = "OTU_14834", x = "fraction", col = "accession")# Passing a dataset object plotgg_taxon(Dat, taxon = "OTU_14834", x = "fraction")plotgg_taxon(Dat, taxon = "OTU_14834", x = "fraction", col = "accession")