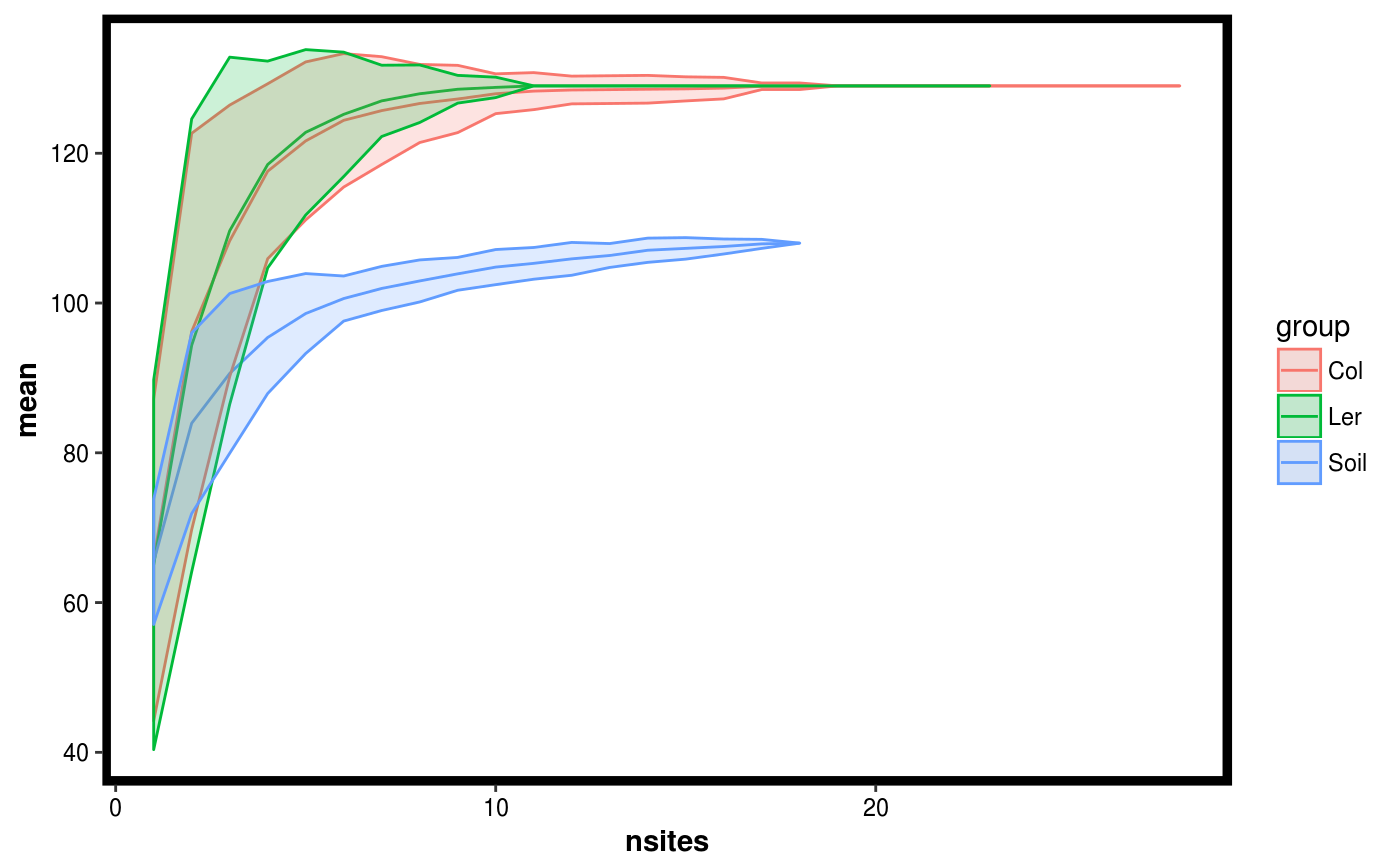
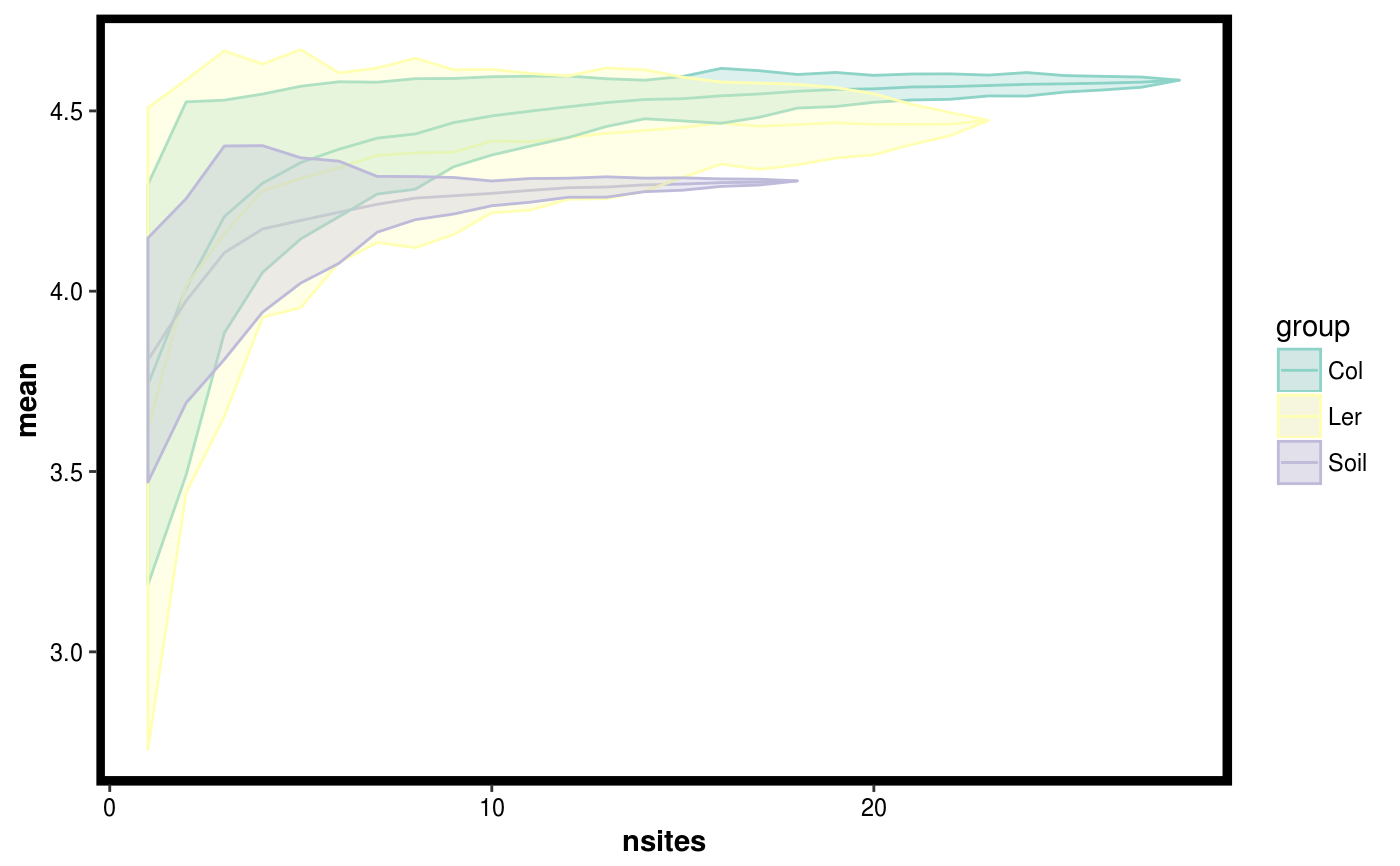
Plot results of of permuting site diversity accross sites.
# S3 method for site.diversity
plotgg(sitediv, p = c(0.025, 0.975), alpha = 0.2,
  theme = theme_blackbox(), confints = TRUE)
Arguments
| sitediv | A |
|---|---|
| p | Vector of length 2 indicating the confidence interval boundaries. |
| alpha | alpha paramater for transparency in ggplot2. |
| theme | theme to use for the plot. |
| confints | Logical indicating whether confidence intervals must be plotted. |
Value
A ggplot2 plot object.
See also
Examples
data(Rhizo) data(Rhizo.map) data(Rhizo.tax) Dat <- create_dataset(Rhizo,Rhizo.map,Rhizo.tax) sitediv.accession <- compare_site_diversity(Dat = Dat,factor = "accession", divfun = total_richness, 20) plotgg(sitediv.accession)divfun <- function(x){ if(!is.null(ncol(x))) x <- rowSums(x) s <- vegan::diversity(x) return(s) } sitediv.accession <- compare_site_diversity(Dat = Dat,factor = "accession", divfun = divfun, 20) plotgg(sitediv.accession, alpha = 0.3) + scale_color_brewer(palette = "Set3") + scale_fill_brewer(palette = "Set3")